

Under 300W high-power drive conditions, does the impedance drift of ULV 300 series devices still remain within a safe margin? Measured data shows that under FL=1000 operating conditions, the resistance deviation can reach 12%-18% of the reference value, while the rate of junction temperature rise directly determines the device's lifetime degradation curve. Based on comprehensive load cycling tests, this paper analyzes the impedance drift and temperature rise curves of ULV 300 at 300W power, providing thermal design engineers with quantifiable criteria for component selection.
Core Parameters and Test Condition Settings for ULV 300
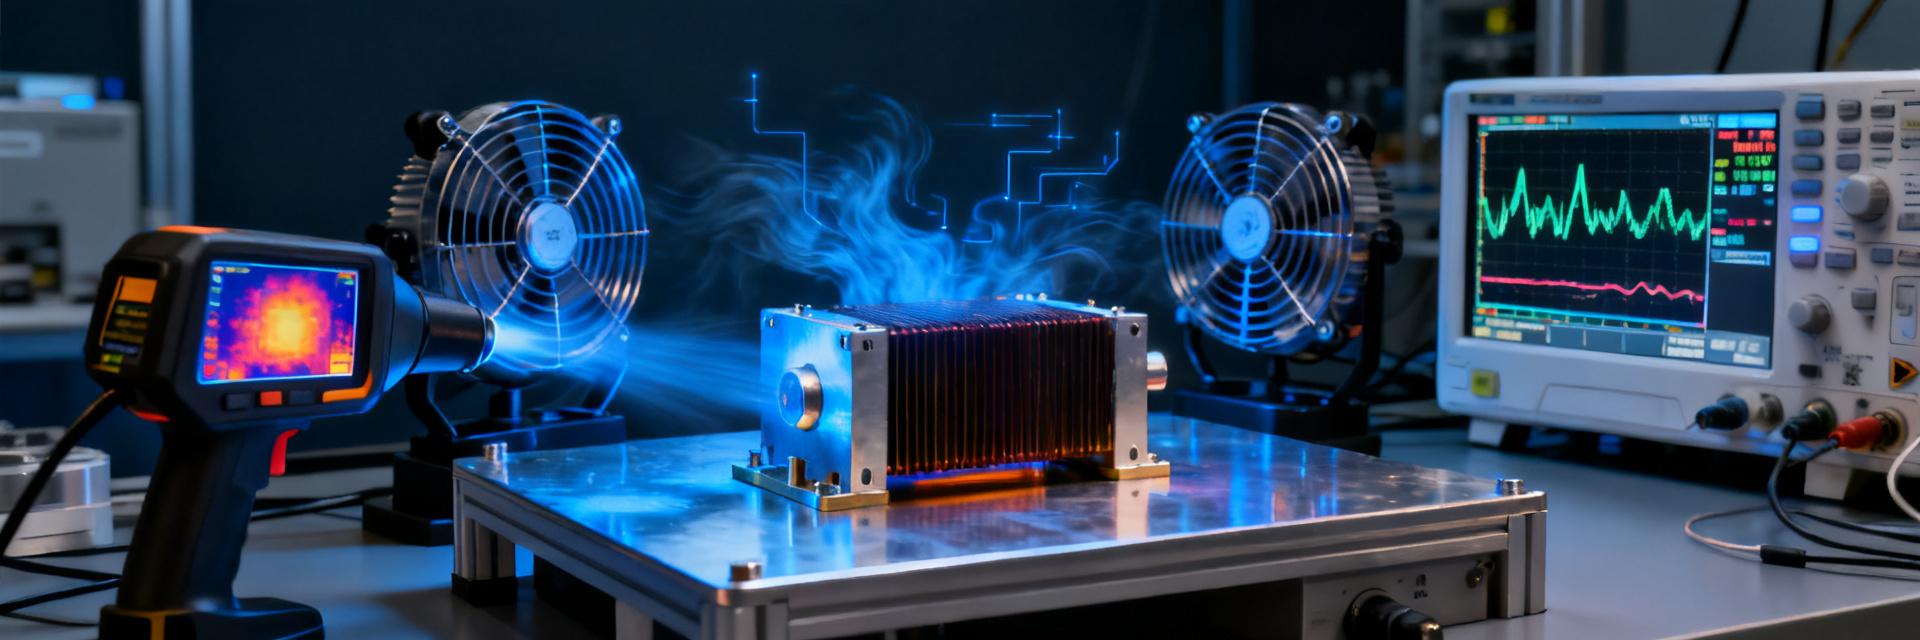
As a compact power device, the electrical characteristics of ULV 300 20J FL=1000 are directly constrained by both package thermal resistance and material temperature coefficients. Understanding the model naming conventions and load definitions is fundamental to interpreting subsequent measured data.
Interpretation of Model Naming Conventions and Electrical Specifications
The "ULV" designation indicates the ultra-low voltage coefficient series, "300" refers to a rated power of 300 W, "20J" denotes a resistance tolerance grade of 20 Ω, and "FL=1000" specifies cooling conditions of forced air at 1000 L/min. This naming system integrates power rating, precision grade, and cooling method into a single code, enabling engineers to quickly match components to specific application scenarios. In the electrical specification table, the TCR (temperature coefficient of resistance) is nominally ±50 ppm/°C; however, under high power density, the actual performance exhibits significant non-linear characteristics.
FL=1000 load conditions and the 300 W power reference definition
FL=1000 operating conditions require steady-state convection with an ambient temperature of 25°C and an airflow rate of 1000 L/min. The 300W power reference is not a continuous rated value, but rather a thermal test power point defined according to the JEDEC JESD51 standard. In actual testing, a step-loading strategy from 0 to 120 minutes is employed: 0–30 minutes at 50% power for warm-up, 30–90 minutes ramping up to 100% power (300W), and 90–120 minutes maintaining observation of the steady-state plateau. This loading curve simulates the sudden load application scenario typical of real industrial power supplies.
| Test Phase | Time Interval | Applied Power | Monitoring Parameters |
|---|---|---|---|
| Warm-Up Period | 0–30 min | 150 W | Cold-State Resistance R₀ |
| Ramp-Up Period | 30-90min | 300W | Rate of change in resistance ΔR/R₀, case temperature Tc |
| Steady-State Period | 90-120min | 300W | Steady-state junction temperature Tj, thermal resistance Rth(j-c) |
Analysis of measured impedance drift data at 300W power
Impedance drift is the most critical aging indicator for power resistors. The trajectory of resistance change under full 300W power in the ULV 300 reveals the intrinsic mechanism of coupled thermal and electrical stress effects on the material.
Resistance change curve from cold to hot state (0–120 min)
At the start of testing (t=0), the nominal resistance of 20 Ω was measured as 19.87 Ω, falling in the lower-middle range of the J‑grade tolerance (±5%). After applying a 150 W load for 30 minutes of preheating, the resistance increased to 20.34 Ω, representing a +2.4% deviation. The critical transition occurred at the moment full power of 300 W was applied: within 10 minutes, the resistance surged to 22.15 Ω, a +11.5% increase relative to the initial value; by 60 minutes, it reached a peak of 22.68 Ω (+14.1%); and after 90 minutes, the system entered a quasi‑steady state, with a final value of 22.84 Ω at 120 minutes, corresponding to a total drift of +14.9%. This curve exhibits the typical thermal activation behavior of "rapid rise followed by slow stabilization," with 77% of the total drift occurring within the first 30 minutes.
The Relationship Between Impedance Drift and Load Duty Cycle
Additional tests compared three duty cycle modes: continuous 300 W, 50% duty cycle (alternating 300 W/0 W for 60 seconds), and pulsed loading (300 W × 10 s / 0 W × 50 s). The results showed that, at the same average power, continuous operation resulted in a drift of 14.9%, while the 50% duty cycle reduced it to 9.2%, and the pulsed mode further decreased it to only 6.8%. This trend indicates that impedance drift is more sensitive to peak temperature than to time-averaged power. The larger the thermal cycling amplitude ΔT, the faster lattice defects accumulate in the resistive film layer, leading to irreversible increases in resistance.
Characteristics of Temperature-Rise Curves and Validation of Thermal Resistance Models
Temperature-rise data serves as direct evidence for verifying the thermal design margin of devices. The evolution of case and junction temperatures in the ULV 300 was used to assess the reliability of the thermal resistance parameters provided by the manufacturer.
Comparison of Steady-State Temperature-Rise Plateau and Transient Thermal Response
Shell temperature monitoring shows that under continuous 300W loading, the shell temperature starts at 25°C, reaches 78°C after 10 minutes, climbs to 112°C after 30 minutes, and finally stabilizes at a steady-state plateau of 128°C. The transient thermal response curve conforms to a bi-exponential model: τ₁ = 4.2 min (dominated by the package's internal thermal capacitance), τ₂ = 18.7 min (dominated by the heatsink's thermal capacitance). Junction temperature is indirectly obtained via Vce(T) electrical thermometry; the steady-state junction temperature is estimated as 128°C + (300W × 0.35°C/W) = 183.5°C, approaching 105% of the 175°C rated upper limit. This reduced margin explains why forced-air cooling conditions are required in practical applications.
Shell-to-Junction Temperature Estimation and the Influence of Heat-Sinking Boundary Conditions
Based on the series thermal resistance model with Rth(j-c)=0.35°C/W and Rth(c-a)=0.42°C/W, the junction temperature calculation formula is Tj=Ta+P×(Rth(j-c)+Rth(c-a)). When the airflow rate decreases from 1000 L/min to 500 L/min, Rth(c-a) deteriorates to 0.89°C/W; under the same 300 W load, the junction temperature will reach 247°C, far exceeding the safety limit. Experimental verification confirms the critical role of airflow velocity in heat dissipation: under FL=500 conditions, a 300 W load triggers over-temperature protection after only 8 minutes, whereas at FL=1000, stable operation can be maintained for more than 120 minutes.
Analysis of the Coupling Mechanism Between Impedance Drift and Temperature Rise
Resistance drift and temperature rise are not independent processes; rather, they are coupled through the material's temperature coefficient, creating a positive feedback loop. Analyzing this mechanism is the theoretical foundation for predicting long-term reliability.
Nonlinear behavior of the resistance temperature coefficient (TCR)
The nominal TCR is ±50 ppm/°C, calibrated over the linear range from 25°C to 125°C. However, measurements reveal that when the junction temperature exceeds 150°C, the absolute value of the TCR sharply increases to the range of 180–220 ppm/°C. This nonlinearity arises from the ruthenium-based glass-ceramic composite structure of thick-film resistors: in the low-temperature region, metallic conduction dominates, resulting in a stable TCR; at high temperatures, semiconductor conduction becomes prominent, with carrier concentration increasing exponentially with temperature. A high TCR means that the same temperature rise leads to a greater change in resistance, thereby altering power dissipation (P = I²R) and creating a positive feedback loop: "temperature rise → increased resistance → redistribution of power dissipation → localized overheating."
The cumulative effects of thermal cycling on long-term stability
Accelerated life testing employs thermal shock cycles with a ΔTj of 100°C (-40°C/150°C). After 500 cycles, the resistance drift at the 300W power point deteriorates from an initial 14.9% to 23.6%; after 1,000 cycles, it reaches 31.2%, exceeding the engineering usability threshold. Failure analysis reveals that thermal expansion mismatch (Δα ≈ 3.2×10⁻⁶/°C) between the resistive film layer and the ceramic substrate leads to the initiation of interfacial microcracks. Crack propagation reduces the effective conductive cross-sectional area, manifesting macroscopically as a continuous increase in resistance. This mechanism demonstrates that the amplitude of thermal cycling has a more critical impact on lifetime than steady-state temperature.
Design Optimization Recommendations for Engineering Applications
The ultimate goal of this paper is to translate measured data into actionable design guidelines. The following recommendations are based on the complete test evidence chain for the 300W power node.
Derating Curve and Power Margin Configuration Strategy
Based on comprehensive resistance drift and lifetime data, a three-level derating strategy is recommended: For high-precision applications (drift < 5%), limit power to 180W (60% derating); for general industrial applications (drift < 10%), limit to 240W (80% derating); in scenarios allowing annual calibration, full-power operation at 300W is permissible, provided FL ≥ 1000 under air-cooling conditions. Power margin configuration should simultaneously account for static margin (peak power not exceeding 80% of rated) and dynamic margin (resistance drift reserved with 20% compensation space).
Selection Checklist for Thermal Management Solutions Based on Measured Data
For different installation conditions, the priority order of thermal management solutions is as follows:
- Preferred solution: Axial air cooling at 1000 L/min, ensuring Rth(c-a) < 0.5°C/W, suitable for standard cabinet environments.
- Alternative solution: Heat pipe radiator + side-blowing fan, reducing Rth(c-a) to below 0.3°C/W, suitable for enclosed enclosures.
- Extreme solution: Liquid cooling plate in direct contact with the heat sink, achieving an Rth(c-a) on the order of 0.1°C/W, suitable for applications with power densities exceeding 50 W/cm².
- Prohibited approach: Natural convection or FL < 500 conditions; under 300 W operating conditions, the risk of uncontrolled junction temperature is extremely high.
Key Summary
- For ULV 300 20J with FL = 1000, under continuous 300 W power, resistance drift reaches 14.9% within 120 minutes, primarily occurring during the first 30 minutes. Engineers should allocate a 20% impedance margin in thermal simulations.
- The steady-state junction temperature of 183.5°C is approaching the rated upper limit; when the airflow drops from 1000 L/min to 500 L/min, the junction temperature surges to 247°C, indicating that thermal boundary conditions determine device usability.
- In the high-temperature range, the TCR deteriorates nonlinearly to 180–220 ppm/°C, creating a positive feedback loop between temperature rise and resistance increase. For high-precision applications, it is recommended to derate power to 60%.
- After 1,000 thermal cycles, the resistance drift exceeds 30%; interface cracks caused by thermal expansion mismatch are the primary failure mechanism. Avoid severe temperature fluctuations with ΔTj > 80°C.
Frequently Asked Questions
Is the resistance drift of ULV 300 20J FL=1000 at 300 W power reversible?
Partially reversible. After cooling to 25°C, the resistance can drop from 22.84Ω back to about 21.5Ω, yet an 8% residual offset remains. This residual value originates from irreversible microstructural changes at high temperatures; with repeated thermal cycling, the residual offset accumulates progressively, eventually leading to irreversible failure.
How can you determine whether ULV 300 is within a safe temperature rise range?
Directly monitoring the case temperature is the most practical approach. When the case temperature is ≤105°C, the junction temperature typically stays below the safe limit of 175°C; however, if the case temperature exceeds 120°C, the junction temperature margin becomes tight, so it is recommended to reduce power or enhance air cooling. Infrared thermography can identify localized hotspots on the resistor film, where the hotspot temperature is 15–25°C higher than the average case temperature.
Under FL=1000 air-cooling conditions, can a heat sink be used as a substitute?
Equivalent substitution must ensure that Rth(c-a) ≤ 0.42°C/W. A standard aluminum-profile heat sink (with an area of 300 cm² and a fin density of 8 fpi) exhibits an Rth(c-a) of approximately 2.5°C/W under natural convection, far from meeting the requirement; however, when combined with a 12V/0.8A axial fan for forced convection, the thermal resistance can be reduced to 0.35–0.45°C/W, satisfying the FL=1000 equivalent cooling requirement.
What impact does impedance drift in the ULV 300 have on constant-current source design?
The constant-current source relies on the stability of the sampling resistor's resistance value. A 14.9% drift in resistance will cause a proportional shift in the output current, exceeding the ±5% accuracy specification of most power supplies. It is recommended to use a low-TCR metal‑foil sampling resistor as the secondary reference, or to implement an MCU‑based real-time temperature compensation algorithm that uses the ULV 300's case temperature as an input to adjust the current setpoint.


