

In the 2025 electronic component market, the demand for high-precision, high-stability thin-film resistors has surged by 35% year-on-year. However, an incorrect datasheet interpretation can lead to a 20% delay in project schedules. Where is the true performance boundary behind the parameters of the ULV 500 N 0.1 J, a "star" model in the industry? We will dissect its "golden parameters" with data and provide a one-stop selection rule.
When selecting thin-film resistors, a minor parameter deviation can be magnified several times in high-temperature or high-frequency environments. Understanding the specifications of precision components like the ULV 500 N 0.1 J is not only a must for engineers but also the key to ensuring long-term product reliability. This article will provide you with an immediately applicable "golden rule" from market positioning to practical selection.
Market Positioning and Core Advantages of the U-Series Thin-Film Resistors
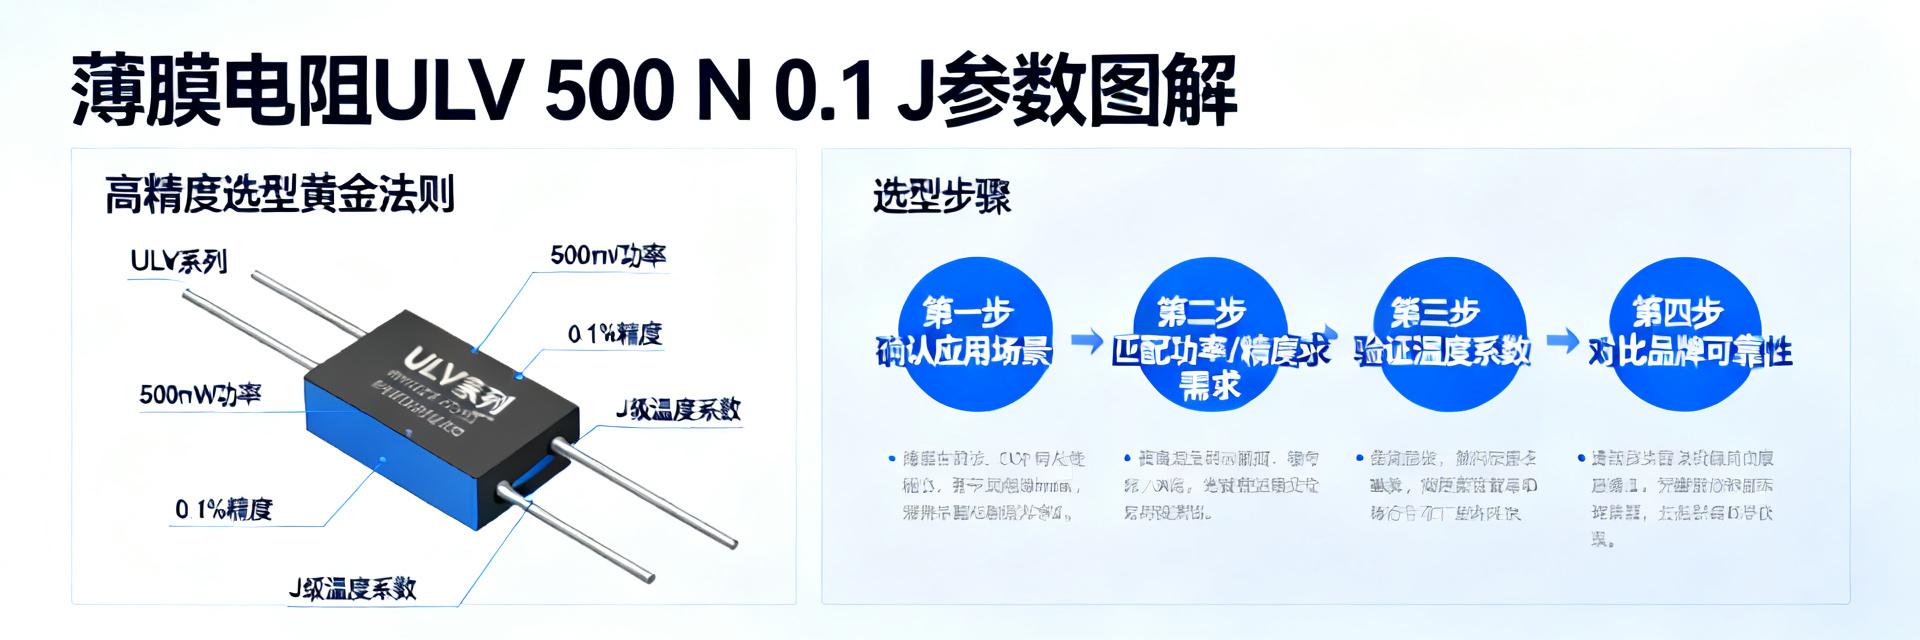
Although traditional thick-film resistors are low-cost, they exhibit numerous shortcomings in harsh applications. With their outstanding physical characteristics, the ULV series thin-film resistors are rapidly becoming the preferred choice in fields such as precision instrumentation, industrial sensing, and telecom base stations. The leap from "general-purpose" to "precision" is not just a technical label, but an order-of-magnitude upgrade in performance indicators.
From "General-Purpose" to "Precision": The Value Leap of the ULV Series
Compared to traditional thick-film resistors, the ULV series demonstrates quantified advantages in temperature coefficient of resistance (TCR), long-term stability, and noise control. For example, the TCR of a typical thick-film resistor is usually above ±100 ppm/°C, while the ULV series can go as low as ±10 ppm/°C. This means that when the ambient temperature changes by 60°C, the resistance of a 1kΩ thick-film resistor might drift by 6Ω, whereas the ULV series drifts by only 0.6Ω. This stability is crucial for edge computing and Industry 4.0 sensing applications in 2025, as it directly determines the signal acquisition accuracy and long-term system reliability.
Part Number "ULV 500 N 0.1 J" Breakdown
The part number "ULV 500 N 0.1 J" contains all the critical specification codes. Among them, ULV represents the series positioned as low-resistance, high-precision thin-film resistors; 500 indicates its nominal resistance is 500Ω; N typically designates a specific package type or terminal structure; 0.1 is the tolerance class, meaning its allowable error is only ±0.1%; and the final J is the temperature coefficient code, representing a TCR of ±50 ppm/°C. Understanding this string of characters is the first step toward correct selection.
In-Depth Analysis of Key Parameters: True Performance Behind the Data
Merely knowing the meaning of the part number is far from enough; the real challenge lies in understanding how these static parameters perform in dynamic applications. Behind every technical specification lies a complex logic concerning reliability, circuit accuracy, and cost trade-offs.
Tolerance and Resistance: Where is the Error Boundary of ±0.1%?
In small-signal processing circuits, a ±0.1% tolerance seems perfect. However, the actual error boundary is affected by multiple factors such as temperature, time, and power consumption. For example, when the ULV 500 N 0.1 J operates continuously in an 85°C environment, its resistance value will drift due to TCR (±50 ppm/°C). Rising from room temperature (25°C) to 85°C, a temperature increase of 60°C will cause a maximum resistance variation of 60 * 50 ppm = 3000 ppm, or 0.3%. This means that, at high temperatures, its effective accuracy may degrade from ±0.1% to approximately ±0.4%. Therefore, when selecting components, you cannot just look at the tolerance at room temperature; you must combine it with your product's operating temperature range to evaluate the true error boundary.
Balance Strategy Between Temperature Coefficient of Resistance (TCR) and Power Rating
There is a delicate balance between TCR and power rating. A lower TCR (such as ±10 ppm/°C) typically implies a more complex process and higher costs. The ULV 500 N 0.1 J, represented by the "J" code (±50 ppm/°C), achieves an excellent balance between performance and cost. In practical applications, adhering to derating principles is crucial. For example, when the ambient temperature is 85°C, its maximum allowable power consumption must be linearly reduced according to the derating curve. A safe design rule is: actual power consumption should not exceed 70% of the rated power. This is not only a prerequisite for ensuring TCR stability but also an important means of extending component lifespan.
| Parameter Dimension | Static Specification | Dynamic Application Impact | Selection Recommendation |
|---|---|---|---|
| Tolerance | ±0.1% | Temperature drift can degrade effective tolerance | Calculate the total error over the entire temperature range |
| Temperature Coefficient (TCR) | ±50 ppm/°C | Directly affects stability at high temperatures | Select a TCR matching system requirements as closely as possible |
| Power Rating | Typical value 1/8W ~ 1/2W | Insufficient heat dissipation accelerates aging and failure | Reserve at least a 30% power margin during design |
Practical Selection: "Golden Rules" from Datasheet to Project
Theoretical knowledge must ultimately serve practical projects. In the face of a dazzling array of alternatives and complex application scenarios, how do we extract effective information from datasheets and make optimal decisions? The following two rules will guide you in the right direction.
Rule 1: Match the Application Scenario (Low Frequency / High Frequency / DC)
The selection focus of the ULV 500 N 0.1 J varies significantly across different application scenarios. In audio amplifier circuits, low noise is the primary consideration, requiring attention to its noise voltage density (nV/√Hz). In power supply sampling circuits, long-term stability (humidity and thermal cycling resistance) is more critical than extreme precision. Meanwhile, in RF matching applications, low parasitic parameters (extremely low inductance and capacitance) become key. The "frequency-impedance characteristic curve," which many engineers overlook, is a must-see. At a frequency of 1 GHz, a resistor's parasitic inductance can cause its impedance to deviate from the nominal value by more than 50%, thereby disrupting the entire matching network.
Rule 2: "Three-Step Verification" for Alternative Evaluation
When evaluating alternatives, never draw conclusions solely based on static parameter matching. It is recommended to perform the following three-step verification method:
- Static Parameter Comparison: Check whether basic parameters such as resistance, tolerance, TCR, power rating, and package type are completely consistent with or superior to the original component.
- Dynamic Characteristic Testing: Test the Q-factor variation and noise voltage density at the target operating frequency. For example, at 10 kHz, the 1/f noise of an alternative might be much higher than the original.
- Life and Reliability Validation: Referencing JEDEC standards, compare critical reliability test data such as resistance to soldering heat and high-temperature storage life. A resistor validated through PCT (Pressure Cooker Test) has far higher long-term reliability than an untested one.
Common Pitfalls and Optimization Recommendations
Even with a clear strategy, common pitfalls still exist during execution, which may lead to project cost overruns or performance issues.
The Pitfall of Blindly Pursuing "0.1%" Tolerance
When the overall system error tolerance is only 1%, selecting a resistor with 0.1% tolerance can be a waste of resources. The cost of high-precision resistors is typically 3 to 5 times that of standard resistors. In many power supply or digital interface circuits, using resistors with ±1% or even ±5% tolerance is fully sufficient. The correct approach is to: perform a system-level error budget analysis, allocating high-precision resistors only to critical sampling, reference, or differential amplifier loops, while boldly using lower-cost components in other non-sensitive areas.
Improper Correlation Between Land Pattern Design and Heat Dissipation
The heat of a resistor is mainly conducted to the PCB through its terminals and pads. For resistors like the ULV 500 N, which typically use 1206 or 2512 packages, the pad size has a huge impact on heat dissipation. A pad that is too small will create a thermal resistance bottleneck, causing the resistor body temperature to rise, accelerating TCR drift, and shortening its lifespan. The optimization recommendation is to: refer to the IPC-7351 standard to design appropriate thermal pads for different power ratings (e.g., 1/4W vs. 1/2W). For high-power applications, thermal vias or copper planes can even be added to assist heat dissipation.
Key Takeaways
- Understand Part Number Coding: Every character in ULV 500 N 0.1 J represents a key specification—from resistance and tolerance to temperature coefficient—forming the starting point for correct selection.
- Focus on Dynamic Performance: Tolerance and TCR degrade under dynamic operating conditions such as high temperatures and high frequencies. The true error boundary must be evaluated in combination with specific application scenarios.
- Adhere to the Derating Rule: To ensure the long-term stability of thin-film resistors, the actual power consumption should not exceed 70% of their rated power. This is the golden rule for improving product reliability.
- Systematically Evaluate Alternatives: Through the three-step "static comparison - dynamic testing - life validation" method, the risks of alternative parts can be comprehensively evaluated, avoiding overall design failure caused by matching only a single parameter.
FAQ
What is the specific meaning of the temperature coefficient 'J' in ULV 500 N 0.1 J?
"J" is the temperature coefficient code, typically representing ±50 ppm/°C. This means that for every 1°C change in ambient temperature, the resistance variation of this resistor is fifty parts per million of its nominal value. For example, for a 500Ω resistor, for every 1°C increase in temperature, its resistance will increase by 0.025Ω.
How to determine if a tolerance specification of ±0.1% is needed during selection?
You need to perform a system-level error budget analysis. If your signal chain's total error requirement is 0.5% and the sum of errors from the amplifier and other components is 0.4%, then the sampling resistor must be chosen with a ±0.1% tolerance. Conversely, if the total error tolerance is 5%, there is absolutely no need to select such a high-precision component.
Is the ULV 500 N 0.1 J suitable for high-frequency applications?
Thin-film resistors typically have lower parasitic inductance and capacitance compared to thick-film resistors, thus performing better at high frequencies. However, whether it is "suitable" depends on the specific frequency. It is recommended to check the frequency-impedance characteristic curve in its datasheet to confirm if the impedance variation at the target frequency (such as 100MHz or 1GHz) is within an acceptable range.
How to ensure the long-term stability of this resistor using derating principles?
To ensure the long-term reliability and minimize temperature drift of thin-film resistors, the actual power consumption should not exceed 70% of its rated power. When the ambient temperature is higher than 70°C (a typical critical point), linear reduction must be applied according to the derating curve in the datasheet to prevent the resistor body from overheating, which causes permanent resistance drift.


